Pakistan textile exports surge by 17.9pc in Sept
For FY 2023-24, Pakistan’s total textile exports were of $16.65b, with modest year-on-year increase of 0.9%
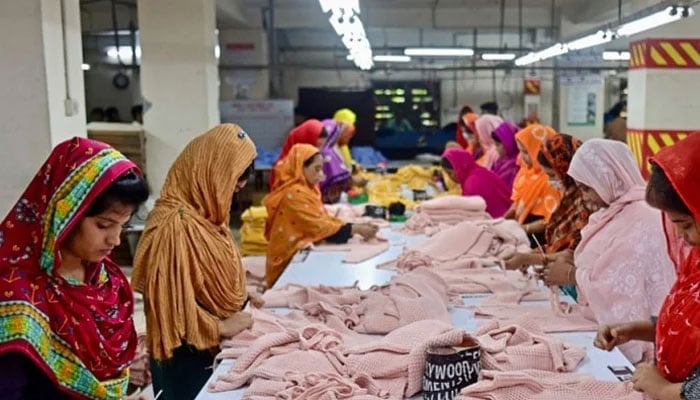
ISLAMABAD: Pakistan’s textile group showed a robust performance for the second month in September 2024, as its sales abroad increased by 17.9 percent to $1.605 billion compared to $1.36 billion in the same month of the last year.
A key aspect of the growth is that all sub-sectors, mainly finished products, saw substantial increases, while exports of unfinished or raw items declined. This signals a shift in the industry toward exporting finished goods rather than raw materials.
Within the textile sector, ready-made garments were the standout category, witnessing growth of 35 percent, according to the latest data from the Pakistan Bureau of Statistics (PBS).
For the fiscal year 2023-24 (July-June), Pakistan’s total textile exports were of $16.65 billion, with a modest year-on-year increase of 0.9 percent.
In September 2024, cotton cloth exports increased by 15.33 percent to $201 million, knitwear exports up by 29.57 percent to $448.3 million, bedwear by 24.8 percent to $290.2 million, and towels by 7.35 percent to $90.55 million. Likewise, readymade garments exports also increased by 35 percent, reaching $338.4 million compared to September 2023.
Exports of unfinished products, primarily raw items, in the sector saw a notable decline. Cotton yarn exports dropped significantly by 54.22 percent, falling to $52 million. Raw cotton exports dropped to zero during the month under review.
Pakistan’s food exports saw an increase in September 2024, rising by 6.36 percent to $604.75 million from $568.6 million in September 2023. Rice exports were a major contributor, totaling $257 million, a 49 percent increase from the previous year. Basmati rice exports surged by 10 percent to $70.6 million, and other rice exports rose by 72 percent to $186.6 million.
But, among other food categories, fish and fish preparations exports decreased by 20 percent to $35 million, fruit exports down by 14.2 percent to $21.6 million. However, meat and meat preparations exports slightly increased by 1.36 percent to $40.5 million, vegetable exports increased by 12.6 per cent to $20.65 million, and sugar exports stood at $28.26 million (last year in this month there was zero sugar exports).
Exports of sports goods declined by 1.9 percent to $31.1 million, with football exports contracted by 9.76 percent to $17.6 million. However, surgical goods and medical instruments exports were up by 2.97 percent to $40.1 million, cement exports up by 5.36 percent to $28.5 million. Likewise, chemical and pharmaceutical exports, also increased 9.63 percent to $141.3 million in September 2024 compared to the same month last year, of which pharmaceutical products exports increased by 61.6 percent to $43.6 million.
Pakistan’s petroleum imports in September 2024 increased by 4.33 percent to $1.39 billion from $1.33 billion in September 2023. Crude oil imports moderately declined by 1.14 percent to $485.3 million, and petroleum products’ imports also declined by 5.6 percent to $514 million over the same month of last year.
Whereas, liquefied natural gas (LNG) imports were up by 23.6 per cent to $312.7 million and liquefied petroleum gas (LPG) increased by 79.92 percent to $76.36 million. For the fiscal year 2023-24, petroleum imports showed a slight decrease of 0.61 percent, totaling $16.9 billion compared to $17.1 billion in the previous fiscal year.
Machinery total imports in September 2024 increased by 36.2 percent year-on-year to $711.4 million. In this group, textile machinery imports increased by 42.2 percent to $17.4 million, power generation machinery by 72.3 percent to $57.3 million, and agriculture machinery by 133 percent to $12.1 million. Likewise, construction and mining machinery imports increased by 73 percent to $12.46 million, and electrical machinery and apparatus saw an increase of 81.8 percent to $272.8 million.
Telecom machinery imports however declined by 3.53 percent to $153 million, with mobile phone imports declined by 17.6 percent to $102.6 million.
The transport sector’s total imports in September 2024 increased by 37 percent to $17.8 million. Of this group, spending on road motor vehicles (built units, CKD/SKD) stood at $166.3 million, 33.2 percent more than the previous year. Imports of completely built units (CBU) for buses, trucks, and other heavy vehicles increased by 17 percent to $25.9 million, with motor car imports rose by 28.9 percent to $20 million. CKD/SKD imports for buses, trucks, and other heavy vehicles also increased by 38.8 percent to $109 million, and motor car imports increased by 48.4 percent to $80.5 million. Motorcycle imports stood at $3.03 million, and parts and accessories imports at $28.6 million.


-
 Prince William Questions Himself ‘what’s The Point’ After Saudi Trip
 -
 James Van Der Beek's Friends Helped Fund Ranch Purchase Before His Death At 48
 -
 King Charles ‘very Much’ Wants Andrew To Testify At US Congress
 -
 Rosie O’Donnell Secretly Returned To US To Test Safety
 -
 Meghan Markle, Prince Harry Spotted On Date Night On Valentine’s Day
 -
 King Charles Butler Spills Valentine’s Day Dinner Blunders
 -
 Brooklyn Beckham Hits Back At Gordon Ramsay With Subtle Move Over Remark On His Personal Life
 -
 Meghan Markle Showcases Princess Lilibet Face On Valentine’s Day
 -
 Harry Styles Opens Up About Isolation After One Direction Split
 -
 Shamed Andrew Was ‘face To Face’ With Epstein Files, Mocked For Lying
 -
 Kanye West Projected To Explode Music Charts With 'Bully' After He Apologized Over Antisemitism
 -
 Leighton Meester Reflects On How Valentine’s Day Feels Like Now
 -
 Sarah Ferguson ‘won’t Let Go Without A Fight’ After Royal Exile
 -
 Adam Sandler Makes Brutal Confession: 'I Do Not Love Comedy First'
 -
 'Harry Potter' Star Rupert Grint Shares Where He Stands Politically
 -
 Drama Outside Nancy Guthrie's Home Unfolds Described As 'circus'